Continuous and Discontinuous Variation in Humans:
Problem statement: Is the height, body weight and fingerprint of each pupil different?
Aim: To study continuous variation and discontinuous variation in humans
Hypothesis: Height, body weight and fingerprint of each pupil is different.
Materials
Graph paper, white papers
Apparatus
Height measuring equipment, weighing machine, ink pad
Procedure
A. Height
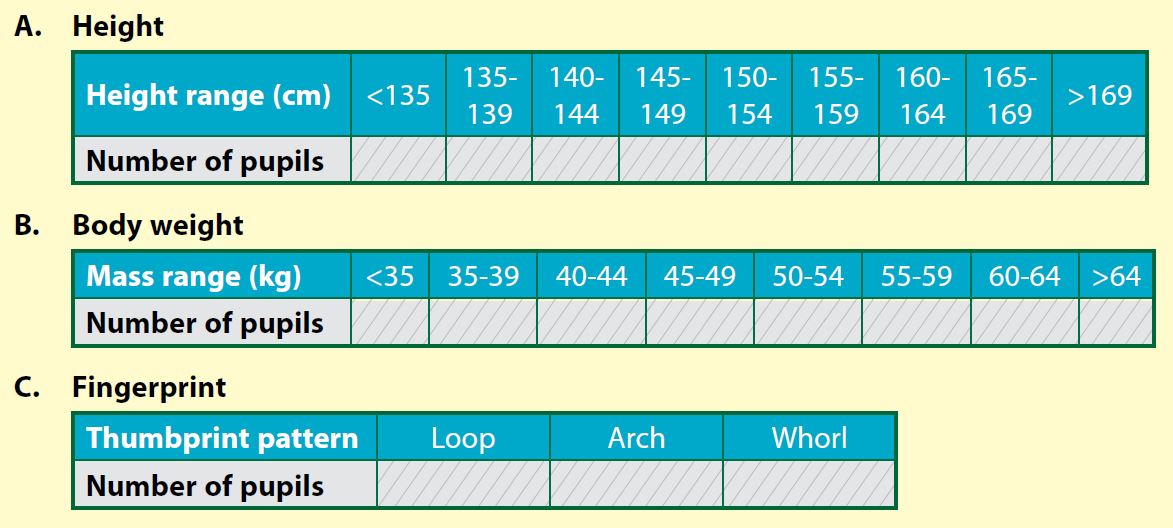
1. Measure and record height of each pupil in the class in the results table.
2. Plot a graph of number of pupils against height range.
B. Body weight
1. Weigh and record body weight of each pupil in the class in the results table.
2. Plot a graph of number of pupils against body weight range.
C. Fingerprint
1. Use the fingerprint patterns shown in page 259 for this activity.
2. Place a thumb surface of each pupil on an ink pad, then press the thumb on a piece of white paper.
3. Record the thumbprint pattern of each pupil in the results table.
4. Build a bar chart based on the results obtained.
Results
Discussion
1. What are the shapes of the graphs plotted for height and body weight?
2. Give inferences for distribution of height, body weight and thumbprint pattern of the pupils in your class.
Conclusion
Is the hypothesis accepted? Suggest a suitable conclusion.
Answer:
Discussion:
1. Graphs of height and body weight characteristics are in the shape of a bell with normal distribution.
2. Both height and body weight of pupils are continuous variations in which there are differences among pupils in each variation but the differences are not obvious whereas fingerprint pattern is a discontinuous variation in which the differences among pupils are clear and distinct.
Conclusion:
The hypothesis is accepted. Height, body weight and fingerprint pattern of pupils are different.